Outbound Sequence Analytics: What to Measure and How to Use It

Most outbound sequence dashboards fail because they show everything and explain nothing. You can see 47 metrics but you cannot answer the question that actually matters: which sequences are working right now and which ones need to be retired.
Here is how to build a sequence analytics setup that is simple enough to use and specific enough to be useful.
The Metrics That Belong in Your Dashboard
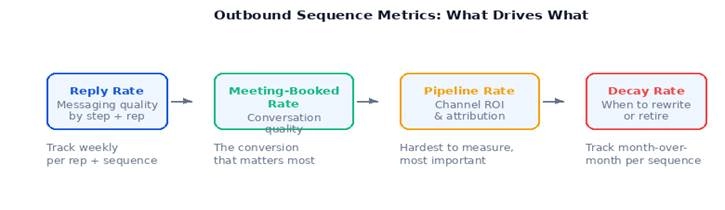
Reply Rate
The most honest signal of whether your messaging is landing. Not open rates, which measure subject line curiosity. Not click rates, which measure whether a link was interesting. Reply rate measures whether a real human decided you were worth responding to.
Track this at the sequence level, the step level, and the rep level. Step-level data tells you where in the sequence people are dropping off. If step 1 has a 12% reply rate and step 2 has a 2% reply rate, you have a specific problem, not a general one.
Meeting-Booked Rate
What percentage of replies converted to booked meetings? This is the conversion metric that connects outbound activity to revenue. A sequence with a high reply rate and a low meeting-booked rate means the replies are happening but the conversations are not qualifying.
Sequence-to-Pipeline Rate
How many of the deals currently in your pipeline can be traced back to a specific sequence? This is the hardest to measure but the most important for defending the investment in outbound as a channel.
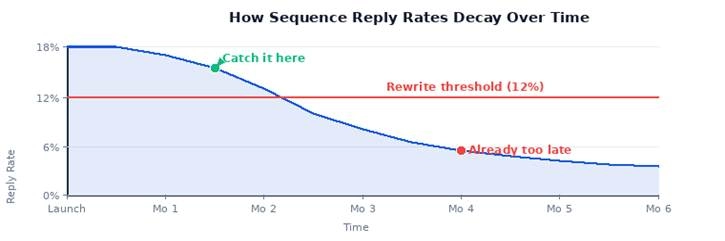
Decay Rate
How is the reply rate trending over time? A sequence that performed at 18% in month one and is now at 6% in month four is in decay. The sooner you catch it, the sooner you can rewrite it rather than burning through your TAM on stale messaging.
What Makes a Dashboard Actually Get Used
The dashboards that get ignored are the ones that require someone to log in, navigate to the right view, and remember what the numbers were last time. The dashboards that get used are the ones that come to you.
Weekly Digest, Not a Destination
A Slack message every Monday with the three sequences with the biggest drop week-over-week is more useful than a beautiful dashboard that no one opens. Decide what the team needs to act on each week and surface only that.
Clear Owners
Every sequence should have an owner who is responsible for its performance. When reply rates drop, the owner gets notified. Without ownership, a dashboard is just a report. With ownership, it is a coaching tool.
Thresholds, Not Just Numbers
A reply rate of 9% does not tell you what to do. A reply rate of 9% against a threshold of 12%, with a label that says "needs attention", does. Build your thresholds into the view so the action is obvious.
Where the Data Comes From
Your sequence data lives in your SEP (Outreach, Salesloft, Apollo, etc.). Most SEPs have some native analytics. The gap is that they show the data in their own format, not connected to the full picture.
If your team is also doing DM outreach, that data is in a separate place entirely. The challenge is getting all of it, email sequences, social DM sequences, follow-up patterns, into a single view.
Letterdrop pulls DM performance data alongside your standard outbound analytics, so you can see the full picture. You can also query it directly through your AI agent: ask which sequences are underperforming this week and get a specific answer, not a dashboard to interpret.
A Simple Starting Template
If you are starting from scratch, here is the minimum viable sequence dashboard:
• Top 5 sequences by reply rate this week
• Bottom 5 sequences by reply rate this week
• Sequences with over 30% decay month-over-month
• Top 3 reps by reply rate vs. bottom 3
• Meeting-booked rate by sequence this quarter
That is five views. If you can answer those questions every week, you have enough to make decisions. Everything else is detail.
The teams that consistently improve outbound performance are not the ones with the most sophisticated dashboards. They are the ones who look at a small number of clear metrics, make decisions based on them, and change what is not working. Build for that.
Subscribe to newsletter
No-BS GTM strategies to build more pipeline in your inbox every week
Related Reading
Some other posts you might find helpful